Chris Zuppa Visuals


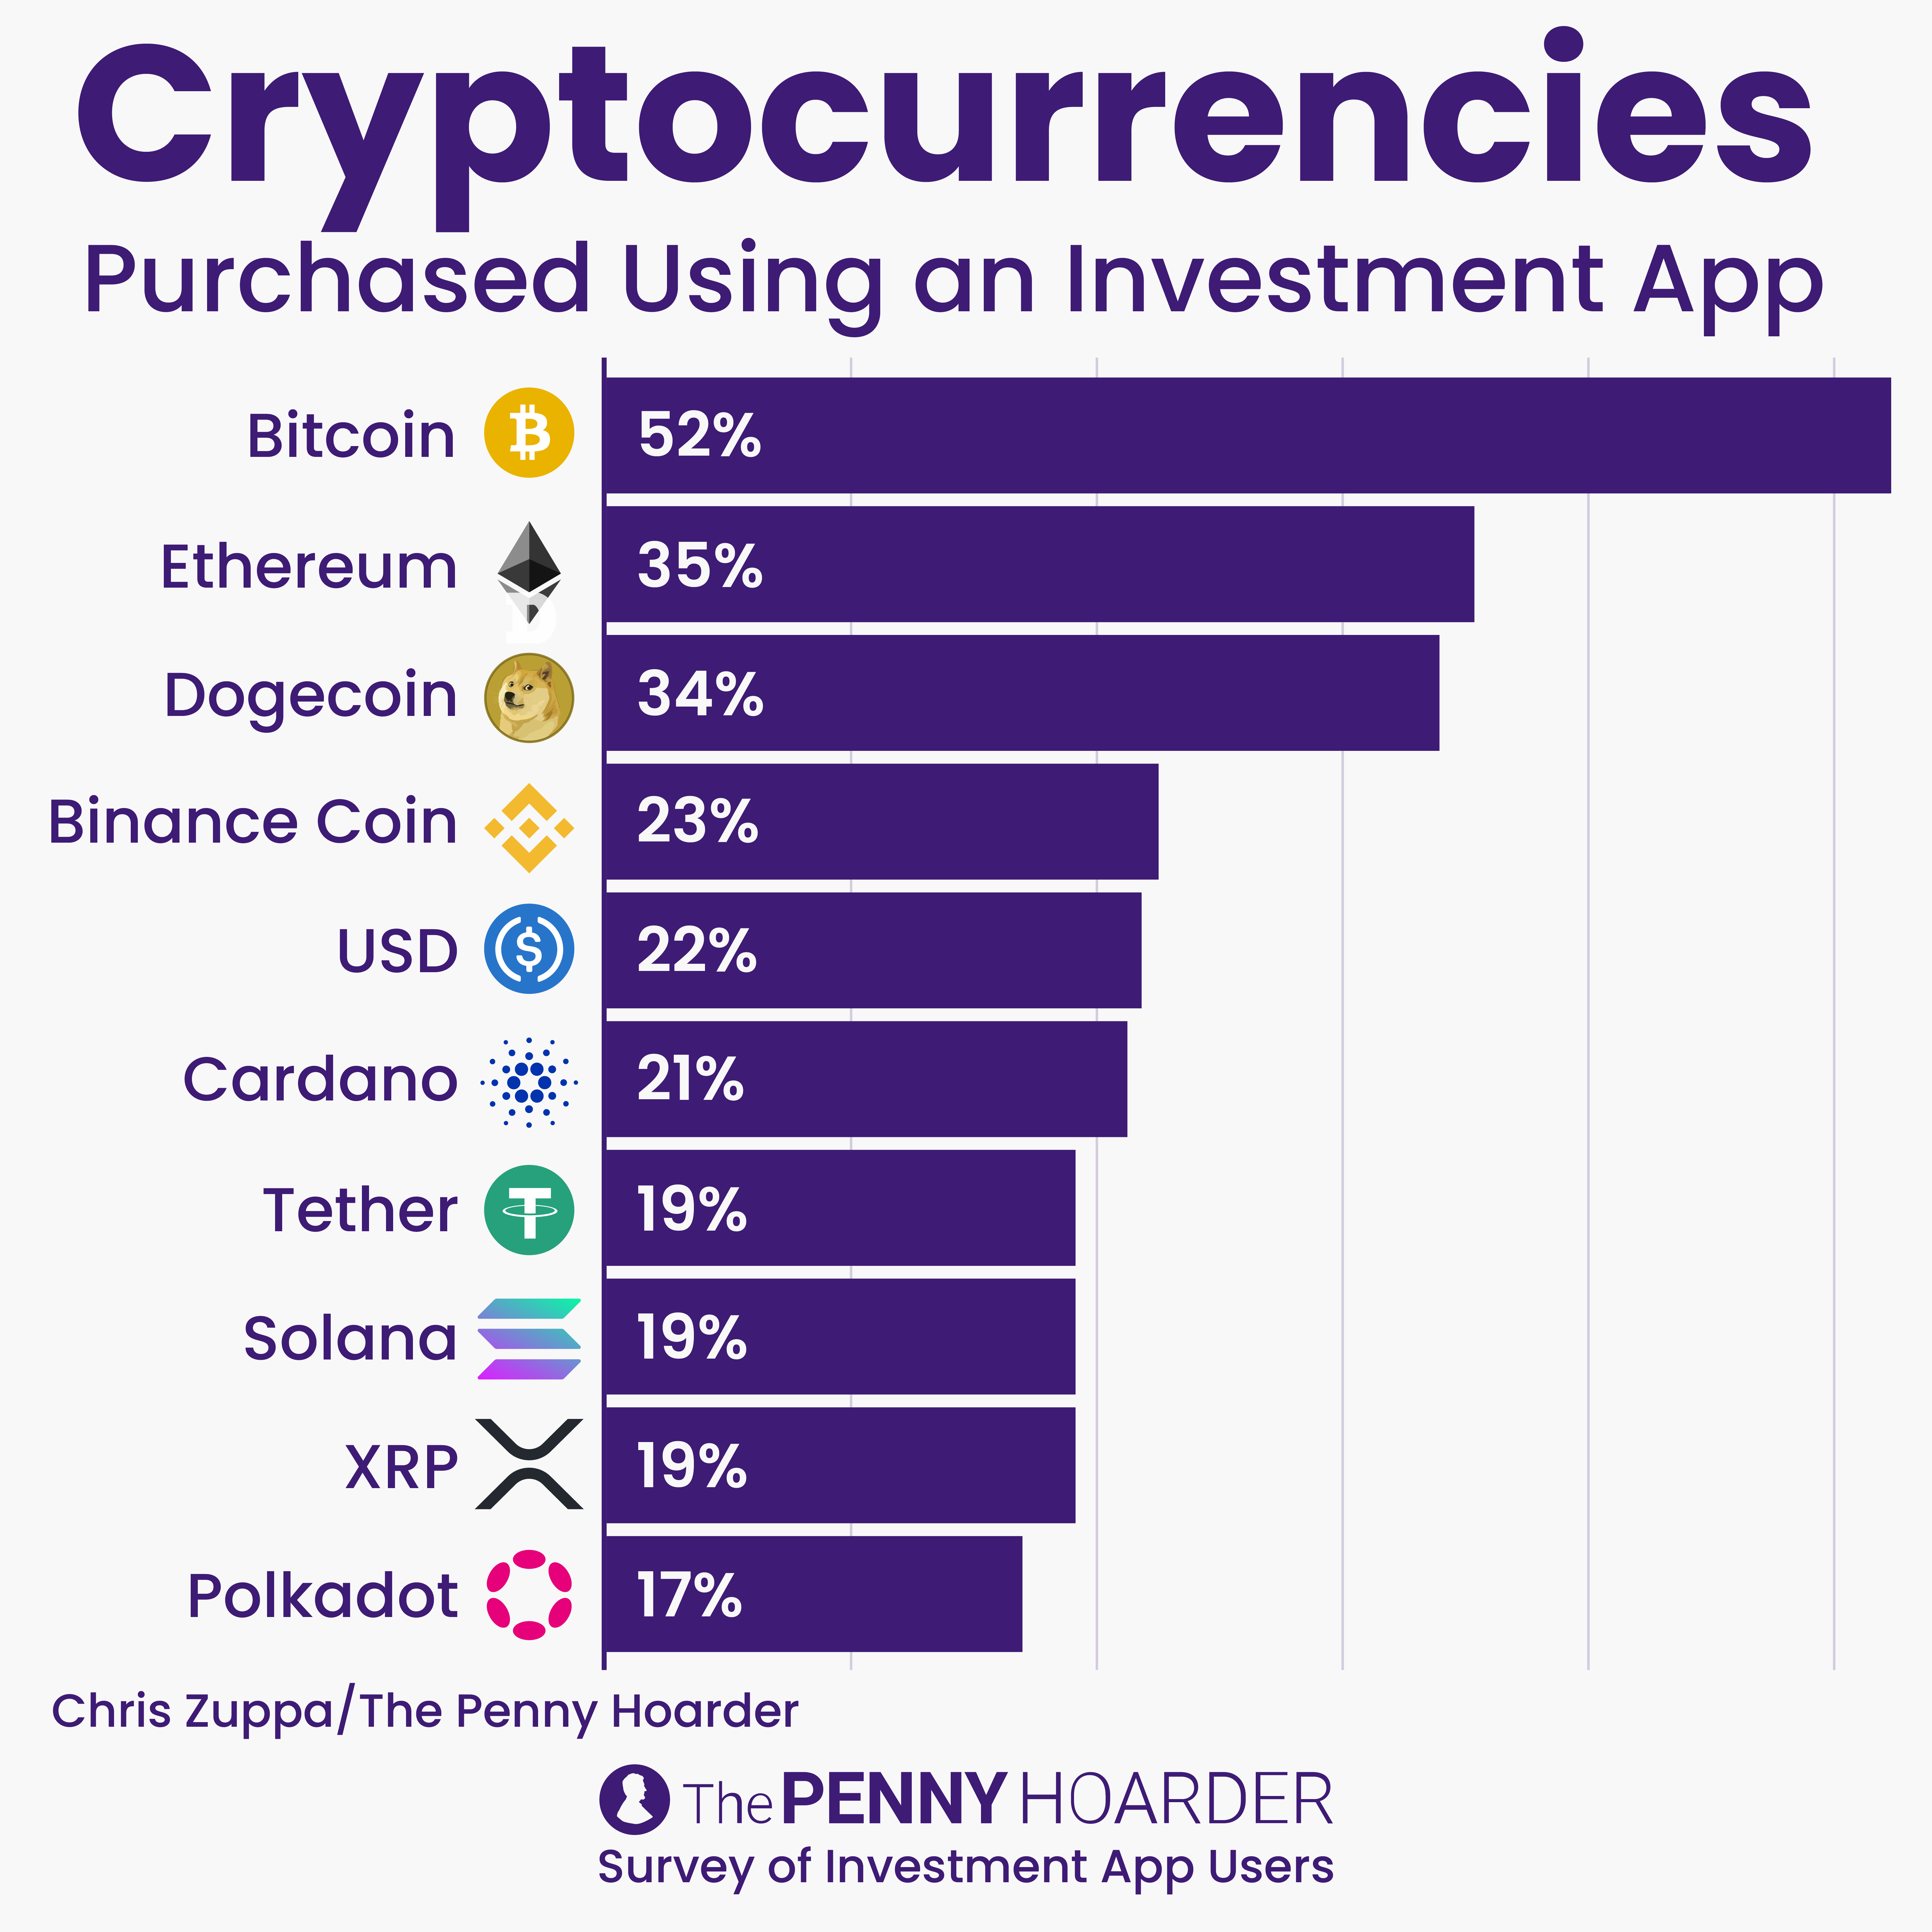


Survey of Investment App Users
About this Project: Investment apps’ low fees and minimum investment requirements have made investing in the stock market easier for many Americans. The Penny Hoarder conducted a national representative survey about investment apps to better understand the growing trend. Key themes explored included:
- Would investors be willing to take advice from a robo advisor?
- How much do Americans rely on social media to consume financial advice?
- Do celebrities sway opinion on cryptocurrency?
I collaborated with Ken Lyons, Director of Visuals, on developing graphics and data visualizations for the stories. I also collaborated with the managing editor, senior editor and reporting team on the data analysis.
Role: Survey development, survey analysis, graphics research, data visualization, image research and graphic design
Survey Analysis: I cleaned the data, compared weighted survey results with unweighted survey results and conducted chi-square tests to test for correlationship between variables. I also wrote the survey methodology and was responsible for organizing the data for writers to report on.
Tools: R Studio, Google Sheets, Infogram, Adobe Illustrator, and Infogram
R Packages: QuestionR, Spatstat, Dplyer and Tidyverse
Key Result: The Penny Hoarder published three stories:
